D3 data visualisation and Browserify
I returned, this weekend, to the visualisation experiments I was working on last year and realised they were in need of some tidying up before I proceeded any further with them.
Some context
Last year, I spent a bit of time carrying out some simple experiments with the JavaScript visualisation library, D3. You can see the experiments I’ve made public collected in my d3-testing repository on GitHub where each sub-folder represents a different experiment.
Each sub-folder is also its own repository however which I pushed to my GistHub account. The reason I did this was that I wanted instant demonstrations of my visualisations. This was possible through Mike Bostock’s Bl.ocks site, which takes Gists on GistHub formatted in a particular way and creates a page for them.
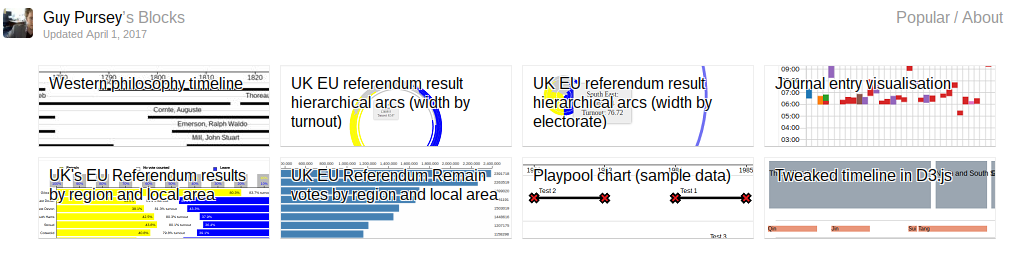
You can see my Bl.ocks page directly but at the time of writing I have about eight simple visualisation experiments visible:
- Western philosophy timeline
- UK EU referendum result hierarchical arcs (width by turnout)
- UK EU referendum result hierarchical arcs (width by electorate)
- Journal entry visualisation
- UK’s EU Referendum results by region and local area
- UK EU Referendum Remain votes by region and local area
- Playpool chart (sample data)
- Tweaked timeline in D3.js
As you can see my predominant interests were in playing with the UK’s EU referendum results data and with exploring different ways of representing timelines.
Two problems
I found two problems with the way I was managing all my visualisations, one to do with standardising code and one to do with the data I was using.
Pushing out code
For the timeline visualisations I was playing around with, I was finding that there were standard approaches I wanted to take. It was this that led me to develop my Node package Dickie dates.
You can read about my blog post on handling awkward dates to find out more about that development. However, my main problem here is that my visualisations were designed to be viewed on Bl.ocks in the browser. Yet the standardised code I’d written for handling dates was a in a package called via a Node require statement.
Also, although many of the examples that Mike Bostock himself gives on Bl.ocks use a <script> tag to pull in the D3 library from an external source, I wasn’t really happy with that. I wanted proper version control on it and I didn’t want to be hotlinking to a library elsewhere.
Pulling in data
At the same time, the data I was using to create these visualisations I had already separated out into other files.
Much of the data I use has started life in a spreadsheet somewhere while I work out ontologies and schemata and then I’ve exported the main sheet I need to a .csv or .tsv file.
I want this separation of data from presentation; I think it’s important.
But, when I opened my single index.html file containing the visualisation locally, so I could see it and amend it before pushing to GistHub, I was getting cross-origin request errors like:
XMLHttpRequest cannot load
file:///home/chronos/u-xxxxxxxxxxxxxxxxxxxxxxxxxxxxxxxxxxxxxxxx/Downloads/Code/d3-testing/journal-entries-ranged-bar-chart/data.tsv. Cross origin requests are only supported for protocol schemes: http, data, chrome, chrome-extension, https, chrome-extension-resource.
This despite the fact that index.html and data.tsv were in the same folder. It’s because the D3 function d3.tsv automatically makes the request an HTTP request.
Solutions
For each of these problems, there was a simple solution, that required a bit of work and which I tested out with my Playpool Chart example but which I should now be able to standardise across all my visualisation Gist repositories.
Enter Browserify
I’d read a little bit about Browserify before and you can read about it too, at the Browserify website.
Essentially it enables you to write code whereby you can call require on Node packages you might need and then it bundles them up into a single file which you can include in your HTML page for using in a browser.
So I created a package.json file, included browserify in my devDependencies and extracted all the JavaScript from my HTML file and dropped into a main.js file.
With the code in main.js I no longer needed by <script> tag for D3; I simply included the line var d3 = require ("d3") in main.js and installed D3 from NPM, making sure I added to my dependencies in package.json with npm install d3 --save as I did so.
To get this to work in the browser, I simply ran browserify main.js > bundle.js and put a reference to <script src="bundle.js"> in index.html.
This still left me with the cross-origin request error around my data file which was not bundled in and could not be because of the way that D3’s tsv function works.
Local hosting
The solution to the data problem was also simple.
I found a package called [http-server on the NPM site]. Wherever you run it, it simply servers up the folder you call in it as a flat file server. This would have been an easy enough piece of code to write myself – but why bother when it’s already been done and particularly given that I’d need to standardise it as some kind of package across all my Gist repos anyway.
So I added http-server to my devDependencies too and as a command to npm start. Now, when I want to view index.html as a working visualisation, I simple call npm start that loads up a server on localhost and I go and visit that.
Further application
Now that I’ve done this with my Playpool chart example, I want to roll out across all my Gist repos.
Template repo
As I see it, each repo now needs to consist of a standard set of files to begin with:
index.htmlpackage.jsonmain.js.block.gitignoreREADME.mdthumbnail.pngdata.tsvor equivalent
And bundle.js of course which will be generated automatically by Browserify as any required Node modules would be by npm install.
To this end, I’ve created a template folder within my d3-testing repo to expedite the creation of visualisations going forward.
Dickie dates
As well as calling in D3 as a Node require and then bundling it up with Browserify, I want to go through a similar process now for my own Node package dickie-dates.
More visualisations!
The whole reason I started looking at this was so that I could start developing visualisations again. I’m still fascinated by timelines and the EU and the UK’s departure from it are still a very topical area to be exploring for visualisation. I’d like to create some useful visualisations soon, rather than simple experiments.