UK General Election 2017 Transfer of Seats (Part 1)
The UK had a general election recently. There were surprising transfers of seats within the House of Commons. Even as I stayed up to watch the results coming in, I started thinking about ways I might try to visualise these transfers of political power. In this first part post of a short series, I’ll talk about how I impatiently got hold of the data I needed to create such a visualisation.
Existing visualisations
Over the last three years, many in the UK have been steadily exhausted by politics.
There was a general election in 2015, the referendum on membership of the EU last year in 2016, and just a few days ago (at the time of writing) another general election.
The flip side of this is that each time I’ve been impressed by a growing sophistication in the way the results have been visualised.
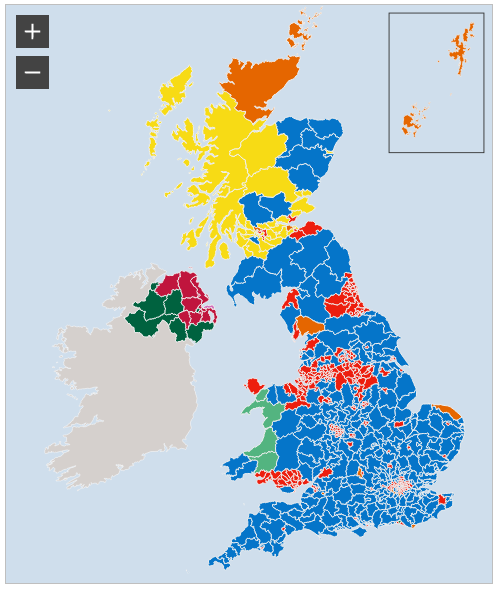
The BBC’s interactive map of the UK constituencies is a useful at a glance guide.
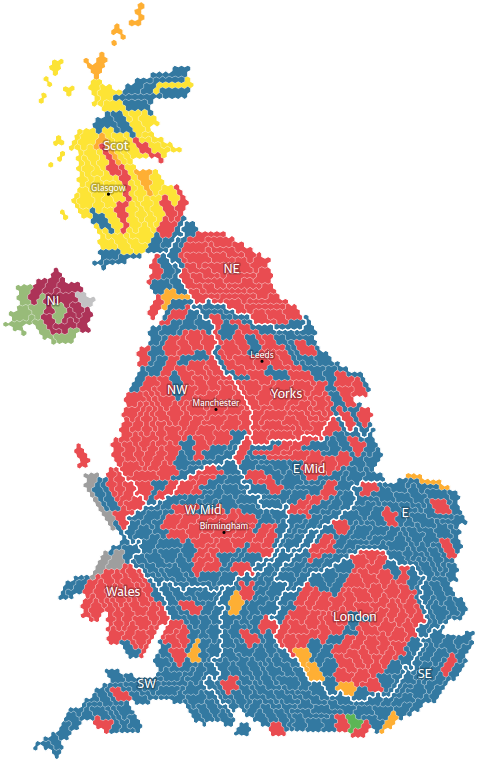
The Guardian have gone for a geographically distorted but electorally more representative map of the results.
My recent favourite, aesthetically, has been on the Financial Times’ election results page, which I’ll come to later.
I’ve already written several posts on trying to visualise last year’s UK referendum on the EU while I got used to the D3 visualisation library as a tool. So I was keen to try to engage with and psychologically process this vote in the same way.
My impatience
Normally, you can find the data for elections and referenda on the UK’s Electoral Commission website. That’s where I got the data to play around with my visualisations of the EU results.
However, even at the time of publishing on Tuesday 13th June, days since results were declared, that data isn’t yet available.
I need to add a personal note here.
In the last month, I’ve had a recurrent corneal abrasion which has at times painfully blinded me in one eye. This is part of the reason for the recent cessation in my blog posts. The enforced break has made me really keen to get back to these projects and experiments.
Combine that with the tension of a general election and by the time the weekend rolled round, I became incredibly impatient to get on with something.
I knew, to begin with, that I wanted to create a simple graph showing how seats had moved from one party to another since 2015.
So I looked into other ways I might get the data.
Finding the data
I really liked the Financial Times’ page on full constituency results.
I realised here that actually, the FT had all the data I needed for the visualisation I wanted to create.
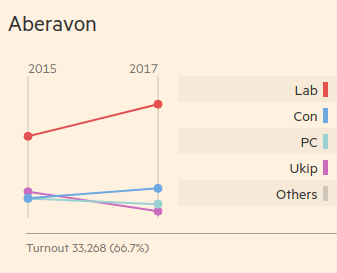
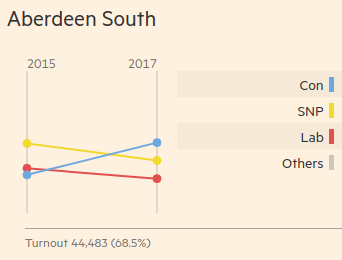
The page features changing vote share for each major candidate in each seat from 2015 to 2017.
I opened up the browser console to double-check:
document.getElementsByClassName("constituency-result")
The reply to this command confirmed there were 650 graphs on the page, representing all 650 constituencies in the UK.
So I knew the complete set was there and I decided to dive in.
Extracting the data
Each graph on the Financial Times page is actually an SVG containing two circles and a line for each major candidate, plus an additional two circles and a single line to represent all other candidates.
For example, here are the SVG tags for the Labour candidate, Stephen Kinnock, in Aberavon.
<line stroke="#99d2d0" stroke-width="2" x1="0" y1="122.58776470588235" x2="130" y2="128.13411764705882"></line>
<circle stroke="#99d2d0" fill="#99d2d0" cx="0" cy="122.58776470588235" r="4"></circle>
<circle stroke="#99d2d0" fill="#99d2d0" cx="130" cy="128.13411764705882" r="4"></circle>
Note the stroke and fill properties all give the same hex code – red for Labour. The visualisations each use a different colour
In theory, I thought, it’s possible to extract just how the seats changed parties, or were held by a particular party, by getting all the lines for a chart and finding the highest y1 value and the highest y2 value in each set of lines.
If I mapped these values to the colour of the line I found them in, then I would have a dataset telling me who won the seat in 2015 and who won the seat in 2017.
The plot thickens
I realised I could grab the plot area for every graph with the following command:
document.getElementsByClassName("constituency-result__plot-area")
From there, I realised that for each one I could grab the lines within it
document.getElementsByClassName("constituency-result__plot-area")[0].getElementsByTagName("line")
Now the first two lines in each of these sets are the left and right boundaries for the plot area, indicating 2015 and 2017. They have the class constituency-result__plot-area. They don’t have any data about the actual results.
I therefore knew I wanted all the lines inside each except these two.
Scraping by
As you may already know, when you scrape a collection of elements from a webpage, the collection doesn’t immediately behave like an array would, with functions to map, reduce, or even loop through each.
In order to scrape all my data into a usable format, I could use a command like the following.
// Example code
Array.prototype.slice.call( htmlCollection )
However, I found there was a more concise way to push a collection of elements into array:
// Example code
[].slice.call(htmlCollection)
Concision has a major advantage when one is doing lots of this within a console window.
So I grabbed all the plots, popped them into an array, and assigned them to a variable called plots.
var plots = [].slice.call(document.getElementsByClassName("constituency-result__plot-area"))
Now for each plot in the array, I’d like to get just the lines that represent the results. To do this, I can simply add an argument to my prototype slice technique to grab just the elements I need.
For example, for the first plot in my new array (plots[0]):
var lines0 = [].slice.call(plots[0].getElementsByTagName("line"), 2)
This gives me an array of just the lines I need.
From this array, I want to find the line with the highest y1 value and the line with the highest y2 value. In some plots, this will be the same line. In any case, I know that each line should have its own unique colour code to represent the party.
So I should be able to reduce each new array of lines to a simple pair of values: a colour code for y1, a colour code for y2.
Party lines
It turs out that “simply” finding the line with the highest y1 value and, if different, the line with the highest y2 isn’t that simple.
First, get the colours for each line, whichever order they are in:
lines0.map(x => x.attributes.stroke.nodeValue)
This returns an array that looks like this:
["#ca6dbf", "#99d2d0", "#6da8e1", "#e25050"]
However we also need a list of the positions on the y1 axis for each line:
lines0.map(x => +x.attributes.y1.nodeValue)
We can sort the lines before we map them though. We can sort them ascending – that is lowest to highest – with a simple a - b sort function pattern.
lines0
    .sort((a, b) =>
        +a.attributes.y1.nodeValue - +b.attributes.y1.nodeValue
    )
    .map(x => +x.attributes.y1.nodeValue)
The two commands, before and after sorting, produce these two lists:
// Unsorted
[
    115.65482352941177,
    122.58776470588235,
    122.17011764705882,
    60.30823529411765
]

// Sorted
[
    60.30823529411765,
    115.65482352941177,
    122.17011764705882,
    122.58776470588235
]
It’s one test but I’m now fairly confident this works.
Now I just need to use replace the map function after the sorting function with one that gives me the colours since the y1 values are only needed for sorting and what I want is the winning party.
lines0
    .sort((a, b) =>
        +b.attributes.y1.nodeValue - +a.attributes.y1.nodeValu
    )
    .map(x => x.attributes.stroke.nodeValue)
This gives me a reordered list of colours, with the first element being the line with the highest point on the y1 axis, the second being the second highest and so on.
["#99d2d0", "#6da8e1", "#ca6dbf", "#e25050"]
You might wonder, given the sort was done in ascending order, why the first element would be the one we need for the highest point on the y1 axis – but that’s because the y axes themselves start with 0 and the coordinate gets higher the further we go down each axis. So the lowest y1 value means the highest point on the chart.
All I need is the first value in the array and I have the winning party colour for 2015.
Left and right…
If I use the same code but replace y1 with y2, I get the 2017 results.
var lines0topcolour2015 = lines0
    .sort((a, b) =>
        +b.attributes.y1.nodeValue - +a.attributes.y1.nodeValue
    ) // Sort by y1 value.
    .map(x => x.attributes.stroke.nodeValue) // Provide just colour codes.
    [0] // Provide just the top colour.

var lines0topcolour2017 = lines0
    .sort((a, b) =>
        +b.attributes.y2.nodeValue - +a.attributes.y2.nodeValue
    ) // Sort by y2 value.
    .map(x => x.attributes.stroke.nodeValue) // Provide just colour codes.
    [0] // Provide just the top colour.
This is just for one plot in our array of 650 constituency plots.
So let’s put it all together with a map function.
[].slice.call(document.getElementsByClassName("constituency-result__plot-area"))
    .map(x => [].slice.call(x.getElementsByTagName("line"), 2))
    .map(function (x) {
            return {
                c2015: x.sort((a, b) =>
                        +b.attributes.y1.nodeValue - +a.attributes.y1.nodeValue
                    ).map(x => x.attributes.stroke.nodeValue)[0],
                c2017: x.sort((a, b) =>
                        +b.attributes.y2.nodeValue - +a.attributes.y2.nodeValue
                    ).map(x => x.attributes.stroke.nodeValue)[0]
            }
        })
Putting this code in the console should give an object for each plot, containing two values: c2015 for the colour hex code of the winning party in 2015 and c2017 for the colour hex code of the winning party in 2017.
Constituent parts
Even though it’s not essential to the visualisation, it would be better if we could also include the name of the constituency in each object so that we cross-reference and double check that the scraping has worked accurately.
So we can adapt the above code to work on each div on the page, rather than just the plot.
This gives us the chance to grab the title for each graph from the associated h4’s textContent property.
[].slice.call(document.getElementsByClassName("constituency-result"))
    .map(x => ({
            constituency: x.getElementsByTagName("h4")[0].textContent,
            lines: [].slice.call(x.getElementsByTagName("line"), 2)
        }))
    .map(x => ({
            constituency: x.constituency,
            c2015: x.lines
                .sort((a, b) =>
                    +b.attributes.y1.nodeValue - +a.attributes.y1.nodeValue
                ).map(x => x.attributes.stroke.nodeValue)[0],
            c2017: x.lines
                .sort((a, b) =>
                    +b.attributes.y2.nodeValue - +a.attributes.y2.nodeValue
                ).map(x => x.attributes.stroke.nodeValue)[0]
        }))
Putting this into a console on the FT page returns 650 objects, each containing a property for the constituency name and the colour hex code of the winning party.
But how to we match the colour codes to actual party names?
Flying colours
Party colours are matched to names on the FT pages with a key contaning individual “swatch cells”:
<td class="constituency-result__swatch-cell">Lab<div class="constituency-result__table-swatch" style="background-color:#e25050"></div></td>
We can easily get all swatch cells on the page:
document.getElementsByClassName("constituency-result__swatch-cell")
That’s 2829 results!
We can convert to an array using the same technique as before:
[].slice.call(document.getElementsByClassName("constituency-result__swatch-cell"))
But we can also reduce that array to an object (hash array) of colour codes and party names:
[].slice.call(document.getElementsByClassName("constituency-result__swatch-cell"))
    .reduce(function(p, c) {
            p[c.firstElementChild.attributes.style.textContent] = c.textContent
            return p
        },
        {})
I went for the attributes of the element rather than the direct style value as I wanted the hex code as originally given not some RGB value.
This returns the following object (display in the console may vary):
{
    "background-color:#6da8e1": "Con",
    "background-color:#65a68c": "Green",
    "background-color:#99bf70": "SF",
    "background-color:#99d2d0": "PC",
    "background-color:#827996": "DUP",
    "background-color:#CEC6B9": "Others",
    "background-color:#bed676": "SDLP",
    "background-color:#ca6dbf": "Ukip",
    "background-color:#e25050": "Lab",
    "background-color:#f0a330": "LD",
    "background-color:#f2d92d": "SNP",
    "background-color:#ffc660": "alliance"
}
We need to lose the background-color: party of each object key in order for the map to work for us:
[].slice.call(document.getElementsByClassName("constituency-result__swatch-cell"))
    .reduce(function(p, c) {
            var colour = c.firstElementChild.attributes.style
                .textContent
                .replace("background-color:", "")
            p[colour] = c.textContent
            return p
        },
        {})
This gives us the much more useful and concise:
{
    "#6da8e1": "Con"
    "#65a68c": "Green"
    "#99bf70": "SF"
    "#99d2d0": "PC"
    "#827996": "DUP"
    "#CEC6B9": "Others"
    "#bed676": "SDLP"
    "#ca6dbf": "Ukip"
    "#e25050": "Lab"
    "#f0a330": "LD"
    "#f2d92d": "SNP"
    "#ffc660": "alliance"
}
Now it’s possible to match each of the winning colours we found earlier to an abbreviated party name.
Colour clashes
But there’s a crucial check I hadn’t carried out. What if the page uses the same colours in some cases to represent different parties?
We can check that pretty quickly. And, as we’ll see, I was, in the end, overly thorough.
Instead of assigning the abbreviated party name to each colour code and potentially overwriting one that might have been stored there before, let’s build an array for each colour code.
[].slice.call(document.getElementsByClassName("constituency-result__swatch-cell"))
    .reduce(function(p, c) {
            var colour = c.firstElementChild.attributes.style
                .textContent
                .replace("background-color:", "")
            p[colour] = p[colour] ?
                p[colour].concat(c.textContent) :
                [c.textContent]
            return p
        },
        {})
Instead of just assigning the party name to that colour key, first the colour key is checked – if it’s null, an array wrapping the party name is assigned and if it’s not null then presumably an array already existings and so the new value is concatenated into the array.
This gives us an array of all the party names, even duplicates, for each colour key. But really we just want the unique ones.
[].slice.call(document.getElementsByClassName("constituency-result__swatch-cell"))
    .reduce(function(p, c) {
            var colour = c.firstElementChild.attributes.style
                .textContent
                .replace("background-color:", "")
            p[colour] = p[colour] || {}
            p[colour][c.textContent] = p[colour][c.textContent] + 1 || 1
            return p
        },
        {})
By creating an each object for each colour key and then creating each corresponding party name as a property of that object, we’re not only able to see a simple list of each of the party names used but we’re also able to see how many times the party name corresponds to that colour:
{
	"#e25050": {
		"Lab": 631
	},
	"#6da8e1": {
		"Con": 631,
		"UUP": 13
	},
	"#99d2d0": {
		"PC": 26
	},
	"#ca6dbf": {
		"Ukip": 518
	},
	"#CEC6B9": {
		"Others": 619,
		"Ind": 18
	},
	"#f2d92d": {
		"SNP": 59
	},
	"#f0a330": {
		"LD": 217
	},
	"#827996": {
		"DUP": 17
	},
	"#ffc660": {
		"alliance": 9
	},
	"#99bf70": {
		"SF": 14
	},
	"#bed676": {
		"SDLP": 12
	},
	"#65a68c": {
		"Green": 45
	}
}
This gives a sense of how serious the problem is, if at all. From that we can work out whether yet another automated and systematic approach is required to parse this data or whether we can now, from this point, take our earlier dataset and the map above and pick through the results by hand.
Basically, our dataset is problematic for all 13 UUP results where the same colour as the Conservatives is used. It’s also potentially a problem for the 18 Independent results where the same colour is used as “Others”.
But, remember, we only care about the top results, since our main purpose here is working out which seats changed hands. Only the winning candidate counts.
Given that the UUP did not win any seats, the use of the same colour as the Conservatives is not a problem.
For the Independents, I’m afraid I did nothing more clever than spend 3 minutes on a Ctrl+F search to find which Independents won their seats. Of the 18 colour swatches across all 650 plots I only found 2:
- John Bercow, Buckingham
- Sylvia Hermon, Down North
But then it occured to me that “Others”, by definition, would never be listed as a winner!
So for our purposes, the original colour map is fine.
A quick aside
Bercow’s Buckingham seat was not contested as he is the Speaker for the Commons. In the UK’s electoral system, one MP is chosen as Speaker. He or she must remain neutral and cannot vote, except in tie-break situations – but he or she is not normally challenged during the election, leaving Buckingham currently without much choice.
Before he was Speaker, Bercow was an MP for the Conservatives. Sometimes, his seat is counted in the total number of seats for Conservatives but, even if this is allowable, the additional seat gained should not grant real power.
Name badges
So in the data, I manually changed Bercow’s Buckingham seat to “Speaker”, just as I will change Sylvia Hermon’s from “Others” to “Independent” – two manual interventions seems a small price to pay for, ahem, true representation.
And I thought I should probably de-abbreviate the names a little.
I don’t mean giving the Conservative party it’s full name (The Conservative and Unionist Party), just something a bit more respectable than “Con”, or for that matter “Lab” for Labour.
[].slice.call(document.getElementsByClassName("constituency-result__swatch-cell"))
    .reduce(function(p, c) {
            var colour = c.firstElementChild.attributes.style
                .textContent
                .replace("background-color:", "")
            p[colour] = c.textContent
                .replace("Con", "Conservative")
                .replace("Lab", "Labour")
                .replace("SF", "Sinn Fein")
                .replace("PC", "Plaid Cymru")
                .replace("DUP", "Democratic Unionist Party")
                .replace("Others", "Independent")
                .replace("Ukip", "UKIP")
                .replace("Green", "Green Party")
                .replace("LD", "Liberal Democrat")
                .replace("SNP", "Scottish National Party")
                .replace("alliance", "Alliance Party")
            return p
        },
        {})
Seating arrangements
So now we have a piece of code for scraping all the colours of the parties, that’s good enough for these purposes. And we have a piece of code for scraping the colour of the party that won in each constituency in 2015 and in 2017.
Finally, we should put them together with some additional code adaptations to give us data we can store in a spreadsheet.
Let’s assign the colour map to the variable partyColours in the console:
var partyColours = [].slice.call(document.getElementsByClassName("constituency-result__swatch-cell"))
    .reduce(function(p, c) {
            var colour = c.firstElementChild.attributes.style
                .textContent
                .replace("background-color:", "")
            p[colour] = c.textContent
                .replace("Con", "Conservative")
                .replace("Lab", "Labour")
                .replace("SF", "Sinn Fein")
                .replace("PC", "Plaid Cymru")
                .replace("DUP", "Democratic Unionist Party")
                .replace("Others", "Independent")
                .replace("Ukip", "UKIP")
                .replace("Green", "Green Party")
                .replace("LD", "Liberal Democrat")
                .replace("SNP", "Scottish National Party")
                .replace("alliance", "Alliance Party")
            return p
        },
        {})
Now let’s assign the result of our original results code to the variable constituentParts in the console.
var constituentParts = [].slice.call(document.getElementsByClassName("constituency-result"))
    .map(x => ({
            constituency: x.getElementsByTagName("h4")[0].textContent,
            lines: [].slice.call(x.getElementsByTagName("line"), 2)
        }))
    .map(x => ({
            constituency: x.constituency,
            c2015: x.lines
                .sort((a, b) =>
                    +a.attributes.y1.nodeValue - +b.attributes.y1.nodeValue
                ).map(x => x.attributes.stroke.nodeValue)[0],
            c2017: x.lines
                .sort((a, b) =>
                    +a.attributes.y2.nodeValue - +b.attributes.y2.nodeValue
                ).map(x => x.attributes.stroke.nodeValue)[0]
        }))
To put them together, let’s map the constituentParts, using the partyColours object, to a new array called seatingArrangements:
var seatingArrangements = constituentParts.map(x => ({
        constituency: x.constituency,
        party2015: partyColours[x.c2015],
        party2017: partyColours[x.c2017]
    }))
Now we just need to extract the array of objects assigned to seatingArrangements in a way that will allow us to dump it in a spreadsheet.
Laying the table
If we want to export the data as JSON, we can use the following code in the console and copy the resulting output to a .json file:
JSON.stringify(seatingArrangements, null, " ")
However, I’m more interested in exporting this in a table-like format. So I’ve done so by joining the array of objects together as a comma-delimited dataset, using this line in the console:
seatingArrangements
    .map(x => `"${x.constituency}","${x.party2015}","${x.party2017}"`)
    .join(" ")
I copied the output to Atom, put a new line at the top in with the header values "Constituency","2015","2017" and saved it as a CSV file called raw.csv.
Prepackaged meals
I’ve explained how I got the data for my simple visualisation. And I’ve made all the code for scraping this data yourself available so you can try it out. I’ve even included the data so that you can compare your own output against this.
Next post, I’ll explain how I used this data to create a visualisation of the transfer of power that happened last week.