Creating a portfolio with Bl.ocks
Over the last couple of months, I’ve created a number of simple visualisations. But, at first, I didn’t give much thought to keeping these organised. So I just dropped them all into one repository. As I’ve created more, however, I’ve realised the need to re-organise them into a portfolio.
D3 testing repo
At first, when I started experimenting with D3 – as first captured in my post on visualising my journal entries – I simply started dropping my code into a single repository. My d3-testing repository on GitHub has been where this code has ended up.
I created a package.json file and a JavaScript file called serve.js for serving different pages I’d created so that the repo could be cloned and served locally with Node.js with minimal effort.
However, the more files I added to this the more I realised that I would need a more organised way of dealing the files. I also wanted an easier way to demonstrate the visualisations I was producing online.
Building Bl.ocks
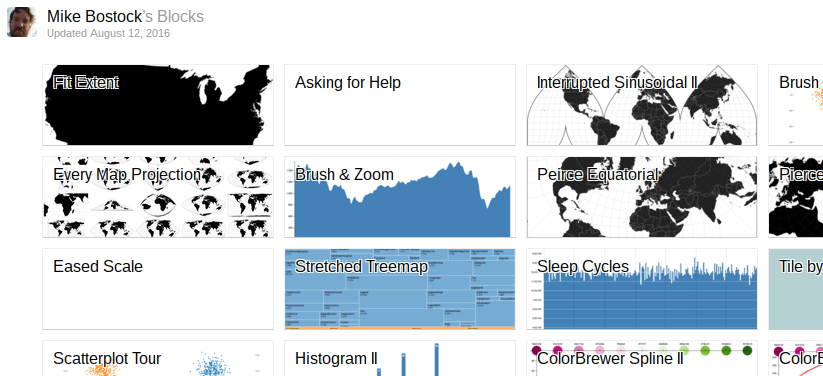
The way I started getting to grips with D3 as a visualisation tool was by learning from Mike Bostock’s various helpful examples, many of which were available from the D3 website itself.
Mike Bostock’s viusalisations appear on a site called Bl.ocks along with many others. You can see the most popular “blocks” on the Bl.ocks homepage.
In most cases, each visualisation appears above some commentary and the code and data needed to create it.
When I looked beyond the visualisations and into the site itself, I found out that Mike Bostock actually created the site himself.
Furthermore, the site simply reads GistHub – normally a more basic version of GitHub used for simple snippets of code. But obviously in this case being used for smarter things.
As the site itself says:
Bl.ocks (pronounced “Blocks”) is a simple viewer for sharing code examples hosted on GitHub Gist. Code up something cool on Gist, then point people here to view it live!
This was an invitation I couldn’t resist.
Getting the Gists
So I started taking code and data from my d3-testing repo and adding them to individual Gists so I could see the results in Bl.ocks.
The first one I did was for an adapted version of a timeline visualisation originally developed by a user called Bunkat.
- I created a Gist for my tweaked version of the Bunkat timeline.
- Automatically I was able to see the Bl.ock visualisation of my tweaked version of the Bunkat timeline, as a result of it being on GistHub.
I covered this in my post on starting work with time visualisations generally.
Previews and thumbnails
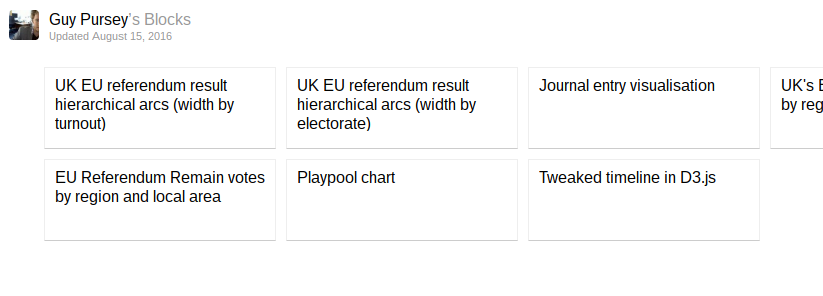
However, as I created more visualisations and they appeared on my automatically generated Bl.ocks profile page, I realised that while Mike Bostock and other users had nice thumbnails for each of their visualisations, my page simply contained lots of boxes with links in.
The Bl.ocks pages does provide specifics on how to label and size an images so that it becomes a thumbnail.
To add a thumbnail preview, add a 230×120 thumbnail.png to your Gist. For social media, you can also add a larger 960×500 preview.png or preview.jpg.
But I couldn’t see any way to upload a file in GistHub.
It dawned on me that far from being a simple snippet tool, I could actually work on Gists locally and then push them to GistHub, in the same way that I could for any Git repo and GitHub.
Creating a portfolio
First, I cloned the Gist into a folder in my local D3 repository.
This was simple as copying the address for the Gist and using it with the git clone command.
git clone https://gist.github.com/guypursey/9a0afb97861ba186799390ff645d2c59
This clone command effectively imported my Gist for the hierarchical bar chart I created on UK EU referendum results, showing “Remain” votes, “Leave” votes, and turnout, by region and area.
It brought the Gist into a folder called 9a0afb97861ba186799390ff645d2c59 based on the address I’d cloned it from. So I renamed the folder.
mv 9a0afb97861ba186799390ff645d2c59 uk-eu-referendum-hierarchical-bar-chart
I then used git mv to move the local version of the file into my cloned sub-directory.
git mv eu-ref.html uk-eu-referendum-hierarchical-bar-chart/index.html
Doing this at first produced an error.
fatal: destination exists, source=eu-ref.html, destination=uk-eu-referendum-hierarchical-bar-chart/index.html
So I had to use a force flag to make it work.
git mv -f eu-ref.html uk-eu-referendum-hierarchical-bar-chart/index.html
The risks of doing this were very small. For a start the history of the file is preserved in both the D3 parent repo and in the sub-directory repo. So a simple reset of either would sort any problems.
But also the two files should be the same. So although I’m effectively overwriting the index.html file in the sub-directory, I’m actually just merging two files with exacting the same contents into one location. I’m letting the Git history show that this is the new location.
So when I run git status on the parent d3-testing repo I get the following change staged
Changes to be committed:
(use "git reset HEAD <file>..." to unstage)

	renamed:    eu-ref.html -> uk-eu-referendum-hierarchical-bar-chart/index.html
But when I run git status in the sub-directory cloned from Gist, I see no change.
On branch master
Your branch is up-to-date with 'origin/master'.

nothing to commit, working directory clean
This is because although I’ve overwritten index.html with the file in the parent folder, both should be exactly the same.
Expanding the portfolio
In the steps above, I describe unifying Gists and GistHub with my d3-testing repo on GitHub.
However, many of the files I’d been working on were not even created as Gists.
Take my journal visualisation hierarchical bar chart for example. I’d commited this to d3-testing so others could see it but it predated my use of GistHub and Bl.ocks. So in this case I had go the other direction and export it to GistHub.
This was also quite straightforward.
First, I created a sub-directory within d3-testing.
mkdir journal-entries-ranged-bar-chart
Then I moved the relevant files there. The data file data.tsv, I simply moved over as-is, but the file ranged bar-chart.html I renamed as index.html when I moved it, to reflect its new position in the sub-directory and for its eventual transition to GistHub where it would need that name to appear as the main visualisaton.
git mv ranged-bar-chart.html journal-entries-ranged-bar-chart/index.html
git mv data.tsv journal-entries-ranged-bar-chart/data.tsv
I then committed these changes and went into the sub-directory and initiated a separate repostiory there.
cd journal-entries-ranged-bar-chart
git init
With that done, I went to GistHub and created a new public Gist with a simple README.md file. This would give me the address I needed to push my new local repository to.
git remote add origin https://gist.github.com/guypursey/ba66c98dd37e53be4eeb134897fcac85
But having created a new README.md remotely, I also needed to ensure that I had that locally too to make sure everything was all tidied up at my end before I pushed remotely.
git pull origin master
This merged the README.md file automatically into the local repo meaning I was now ready to push the whole lot.
git push origin master
In this way, I started moving all visualisation files I had previously been working on flat in the repository into sub-directories which I then made into their own repositories which could get pushed to GistHub.
Serving the files
As a result of all this relocating of files, I had to rewrite Node file I’d created to serve the visualisations in d3-testing.
So now not only are there new addresses but each time the router is called different files are served up for general use:
app.get('/eu-ref', function (req, res) {
  var content = fs.readFileSync('uk-eu-referendum-hierarchical-bar-chart/index.html', 'utf8')
  app.use(express.static('./uk-eu-referendum-hierarchical-bar-chart'))
  res.send(content)
})
I’m still using short-hand +1 addresses like eu-ref to access the files. And there’s still no homepage as such. But this will come soon.
Duplication
Having done all this, I see a lot of duplication or rather replication and therefore potential for further reorganisation and refactoring.
To name but a few areas:
- Double Git commands. I’m now having to type the same sets of commands twice with slight variations: once for the
d3-testingrepository and once for the Gist repository at the sub-directory level. - Data replication. My recent experiments with EU data mean that I reference the same data from a number of visualisations. At the moment this data appears as a separate file in each Gist folder. There might be a way to centralise this and still refer to it on GistHub..
- Server code replication. The server file described above repeats the same pattern with different variables for each of the Gist folders now committed to
d3-testing. This code can probably be refactored.
Summary
There’s still a lot of work to do. The visualisation themselves still need work. But in reorganising everything and making it available at the single repo level and through individual Gists which are then showcased through Bl.ocks, I feel I’ve made real strides towards having a central place to store, version and centralise anything I might be working on.